OXFORD DAY DASHBOARD
- Adobe Illustrator
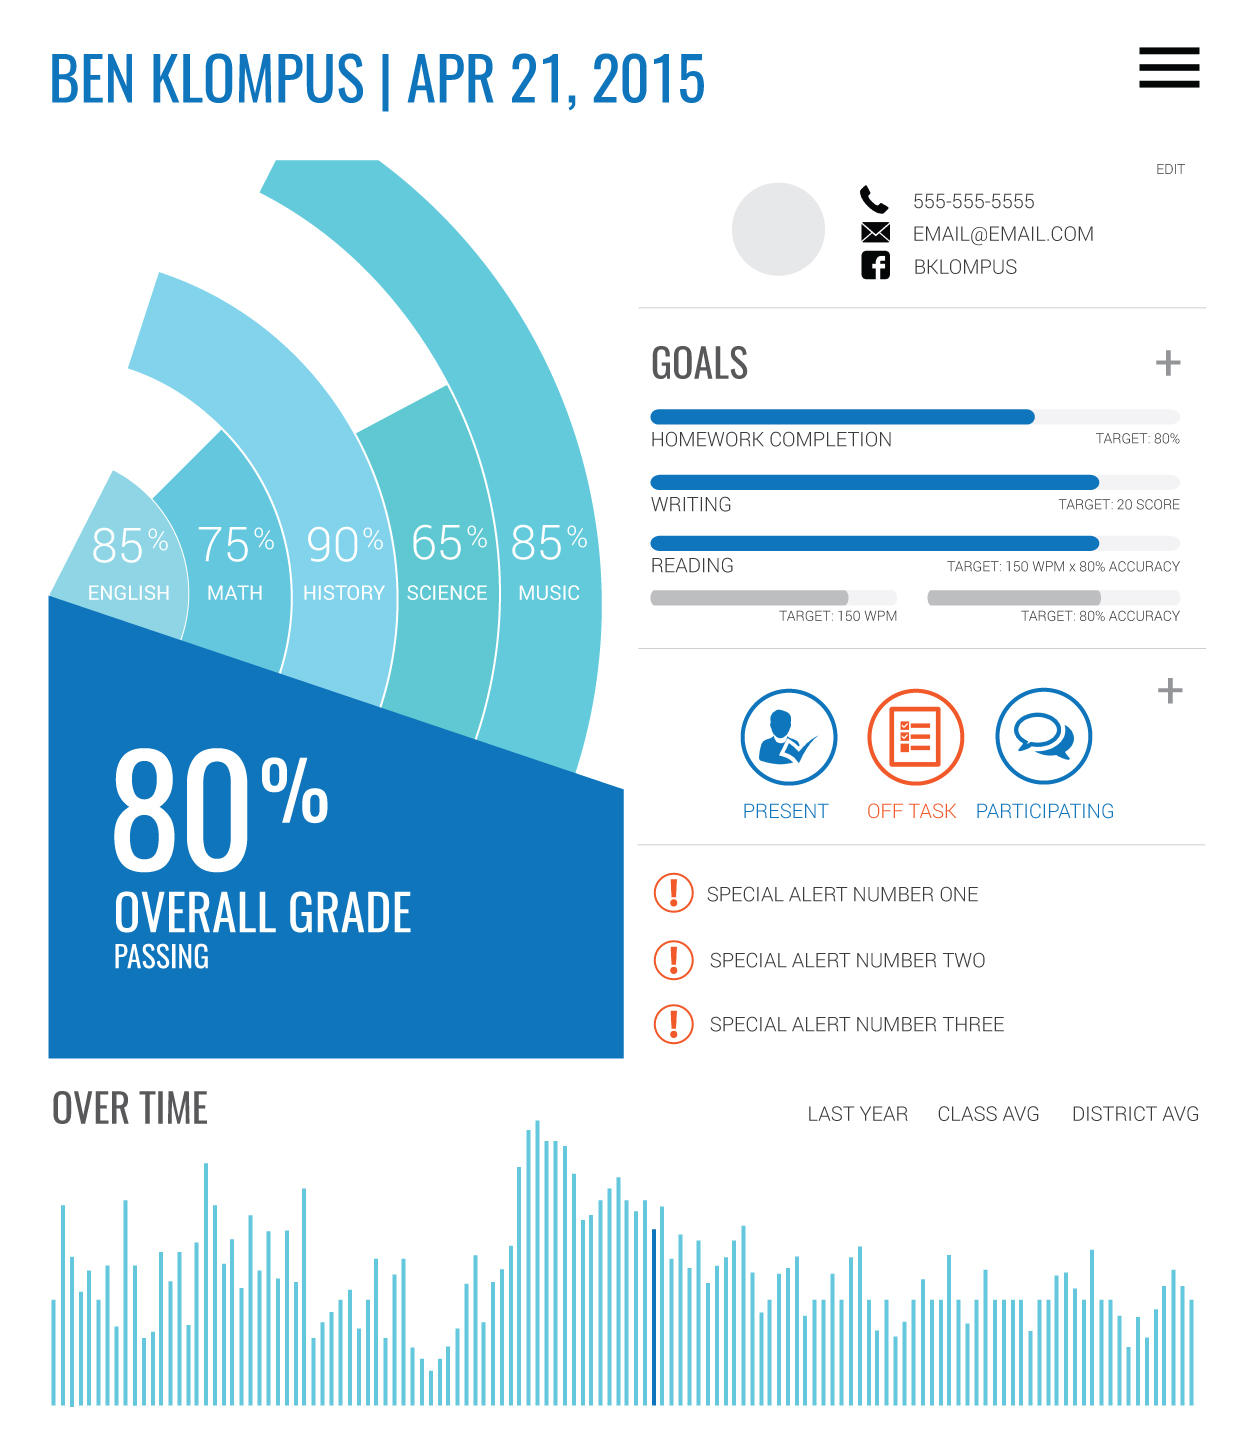
Oxford Day is a startup charter school that blends some of the highly personalized and Socratic teaching methods of elite prep schools with technology-enabled learning and tools that drive down non-teaching costs and free up teachers' time. With these among other innovations, the school is able to bring elite prep school quality education and support for free to middle and lower income students.
A key part of Oxford Day's system is a fully connected and live-updated data backbone that is easily generated and digestible for its audiences. These audiences include principals, teachers, counselors, social workers, parents, and students. The images here are an initial attempt to design what that dashboard would look like on an student and school level. The types of data included in these dashbaords are informed by an ex charter school principal, Ben Klompus.
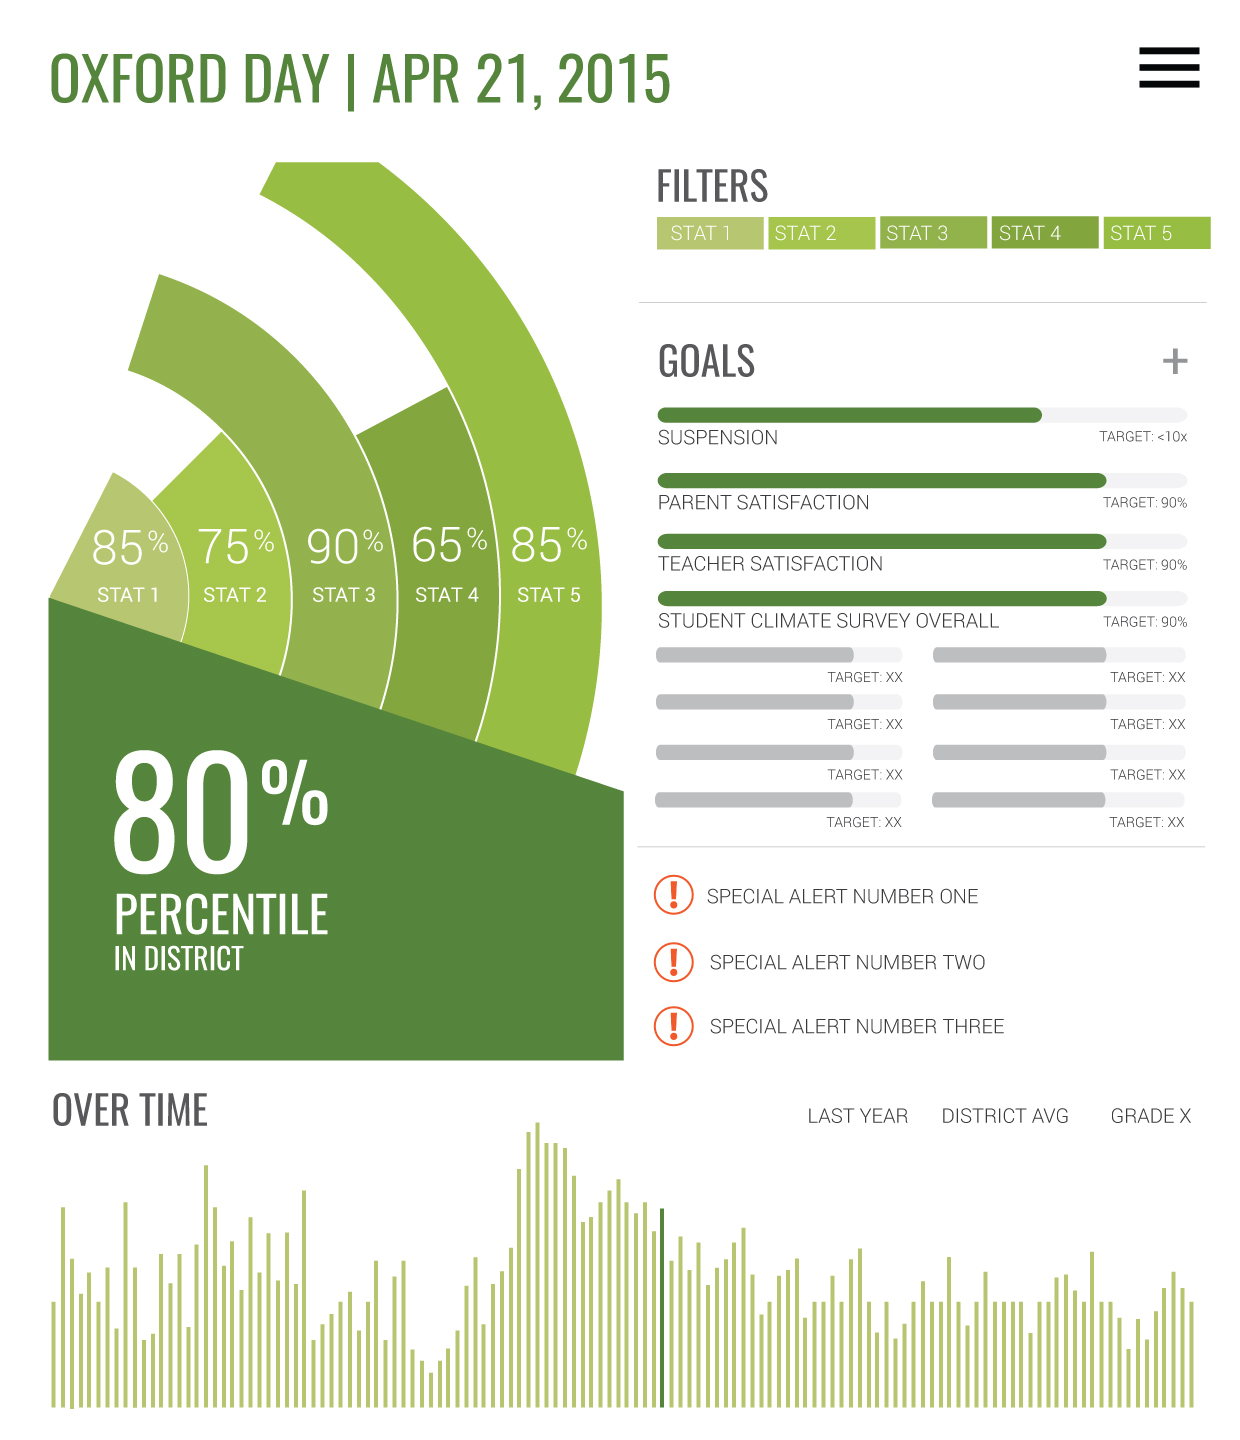
The goal with these dashboards is to allow the main stats to be picked up at a glance -- overall grade / percentile, goal progress, and general trend over time. The intention is for the information to be dynamic -- by hovering over and / or clicking on different points in the timeline at the bottom, the stats above will adjust to reflect where they were at those points in time.